Install and design K8s cluster
- Purpose
- Education
- Minikube
- Single node cluster with kubeadm/GCP/AWS
- Development & Testing
- Multi-node cluster with a Single Master and Multiple workers
- Setup using kubeadm tool or quick provision on GCP or AWS or AKS
- Education
- Hosting Production Applications
- On Prem
- Kubeadm is very useful
- Cloud
- GCP
- AWS
- Azure
- On Prem
- Workloads
- How many?
- What kind?
- Web
- Big Data/Analytics
- Application Resource Requirements
- CPU Intensive
- Memory Intensive
- Traffic
- Heavy traffic
- Burst Traffic
Stroage
- High Performance – SSD Backed Storage
- Multiple Concurrent connections – Network based storage
- Persistent shared volumes for shared access across multiple PODs
- Label nodes with specific disk types
- Use Node Selectors to assign applications to nodes with specific disk types
Nodes
• Virtual or Physical Machines • Minimum of 4 Node Cluster (Size based on workload) • Master vs Worker Nodes • Linux X86_64 Architecture • Master nodes can host workloads • Best practice is to not host workloads on Master nodes
Troubleshooting
Application Failure
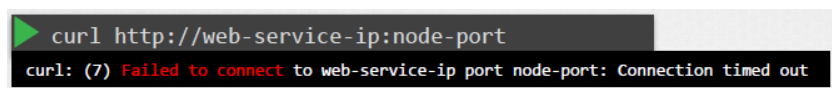
In this lecture we will go step by step in troubleshooting Application failure. To check the Application/Service status of the webserver
curl http://web-service-ip:node-port
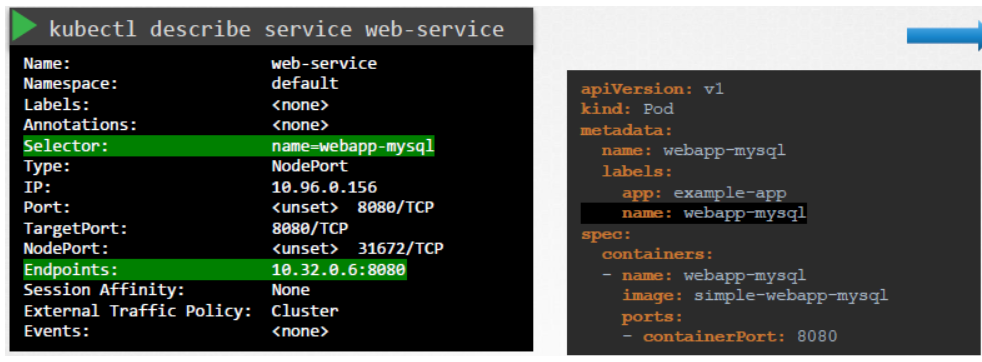
To check the endpoint of the service and compare it with the selectors
kubectl describe service web-service
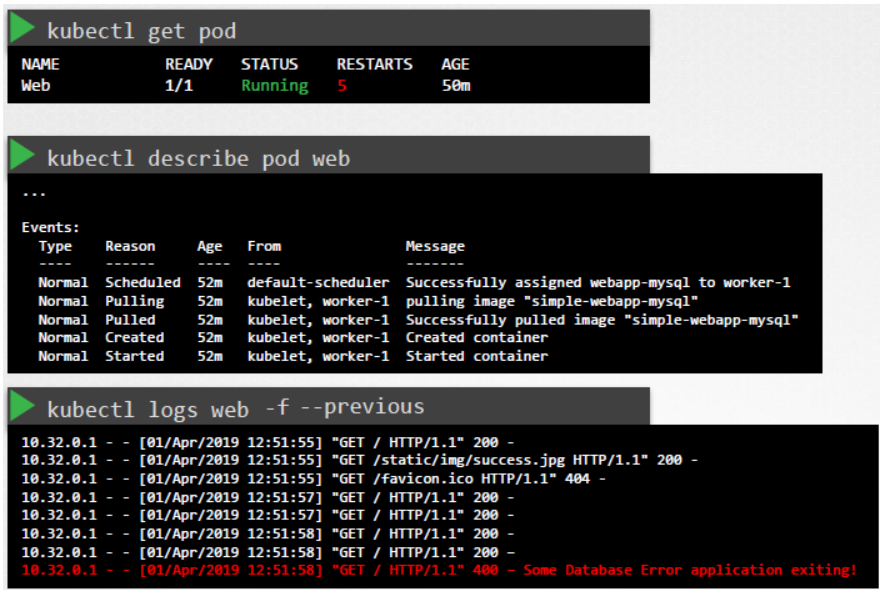
To check the status and logs of the pod
kubectl get pod
kubectl describe pod web
kubectl logs web
To check the logs of the previous pod
kubectl logs web -f --previous
Control Plane Failure
In this lecture we will use how to troubleshoot the Control Plane components. To check the status of the nodes if they are healthy
kubectl get nodes
To check the status of the pods if the are running
kubectl get pods
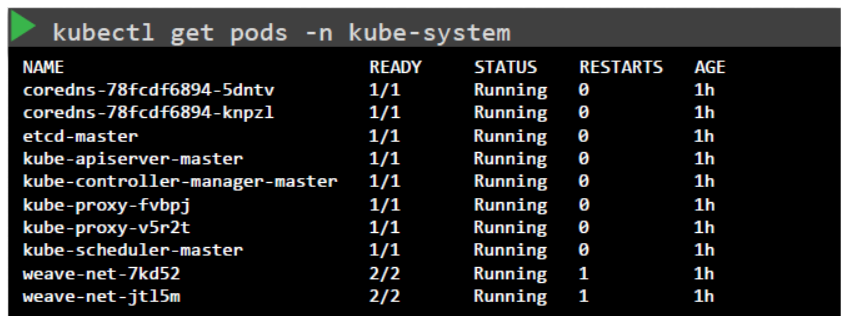
To check the status of all the pods of the Control Plane components(if they are deployed with kubeadm tool) and make sure they are Running
kubectl get pods -n kube-system
If the Control Plane components are deployed as services then check the status of all the components
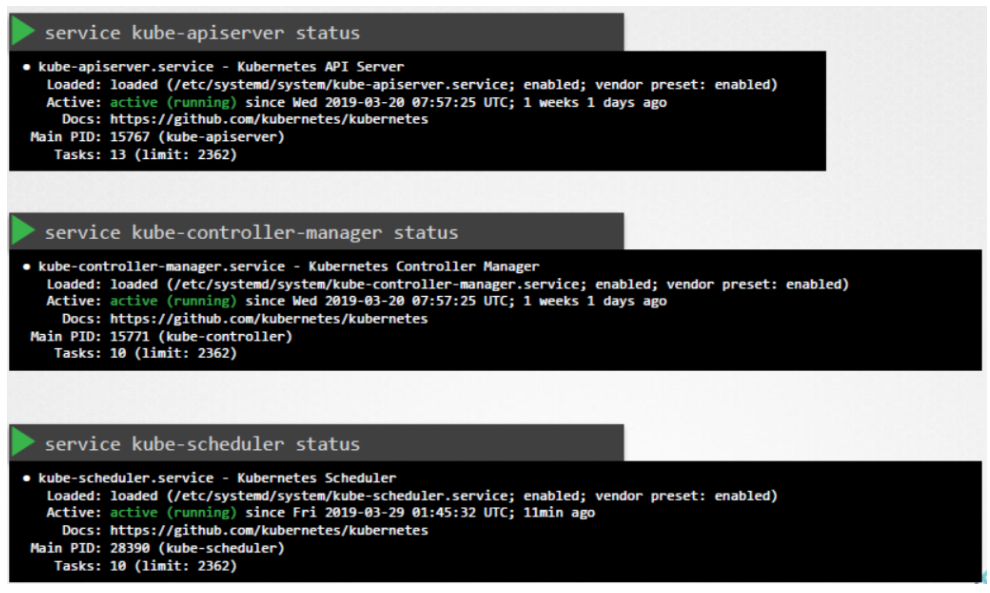
To check the status of kube-apiserver
service kube-apiserver status
To check the status of kube-controller-manager
service kube-controller-manager status
To check the status of kube-scheduler
service kube-scheduler status
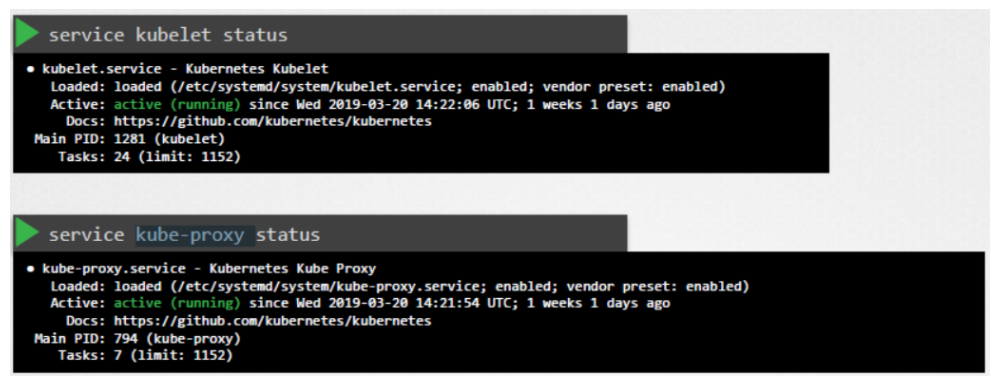
To check the status of kubelet
service kubelet status
To check the status of kube-proxy on the worker nodes.
service kube-proxy status
To check the logs of the Control Plane components deployed as Pods:
kubectl logs kube-apiserver-master -n kube-system
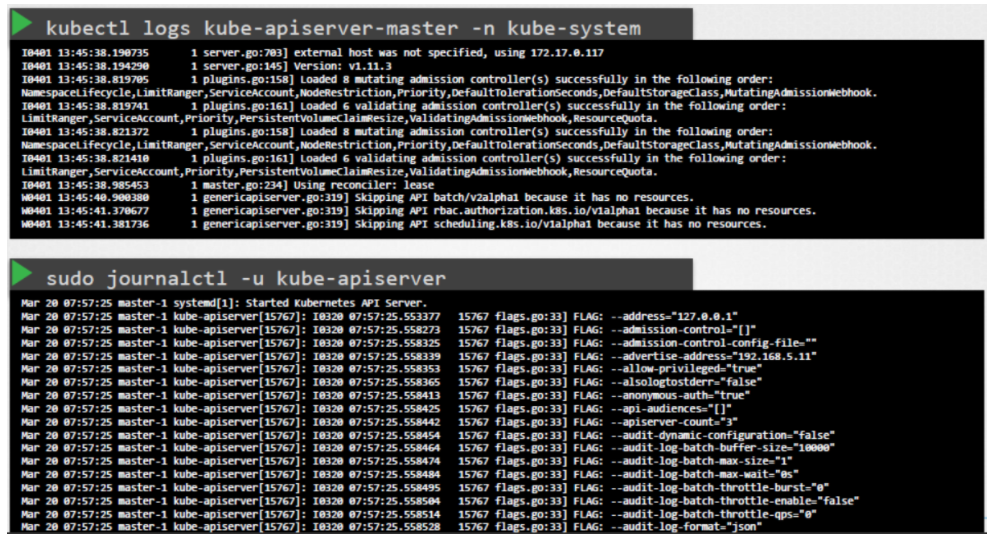
To check the logs of the Control Plane components deployed as SystemD Service
sudo journalctl -u kube-apiserver
Worker node failure
Lets check the status of the Nodes in the cluster, are they Ready or NotReady
kubectl get nodes
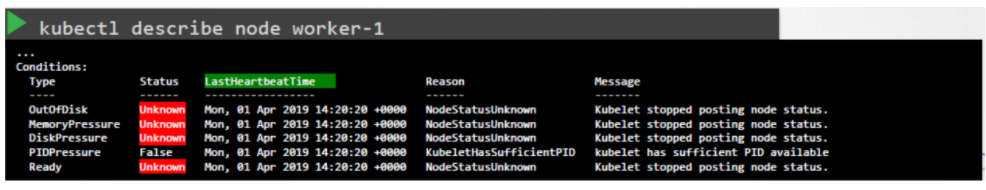
If they are NotReady then check the LastHeartbeatTime of the node to find out the time when node might have crashed
kubectl describe node worker-1
Check the possible CPU and MEMORY using top and df -h
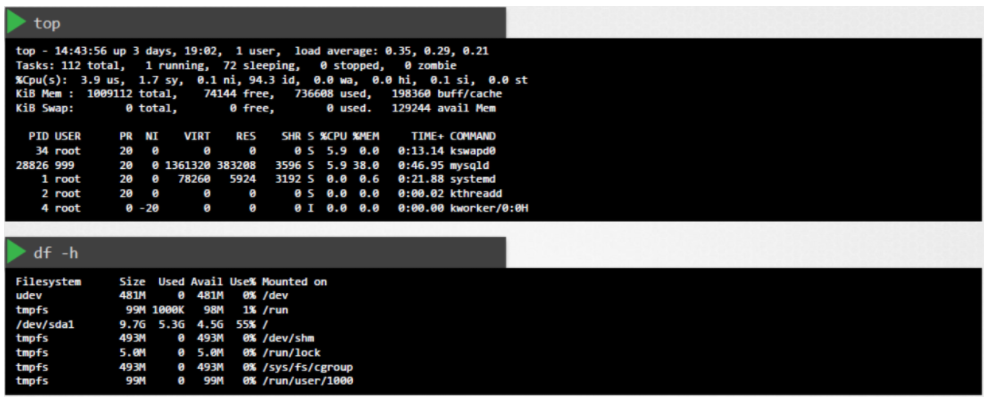
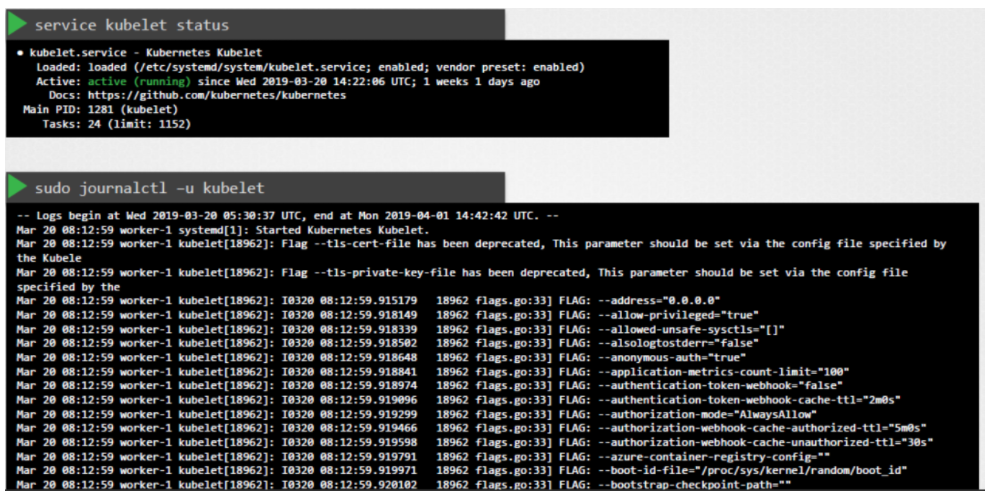
Check the status and the logs of the kubelet for the possible issues.
serivce kubelet status
sudo journalctl –u kubelet
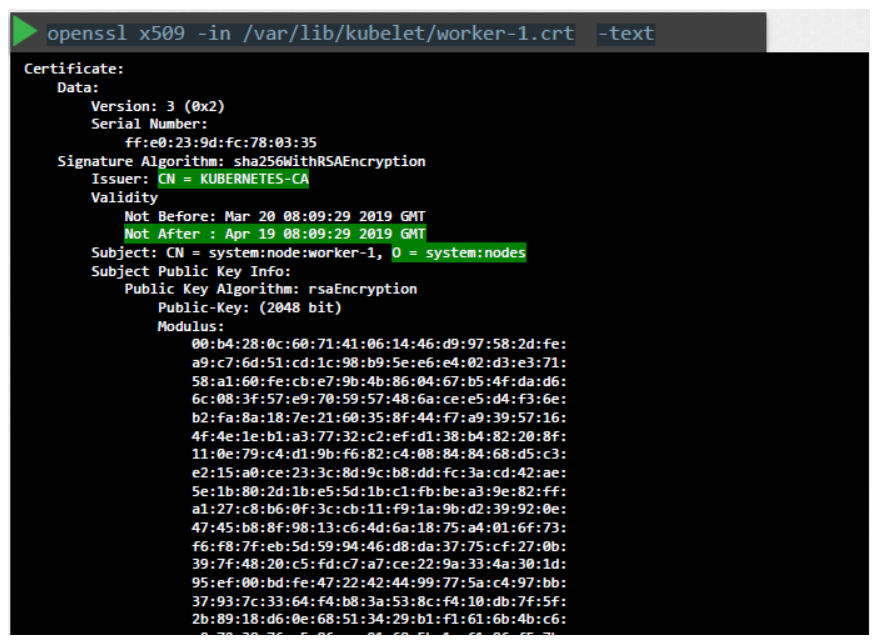
Check the kubelet Certificates, they are not expired, and in the right group and issued by the right CA.
openssl x509 -in /var/lib/kubelet/worker-1.crt -text
Advance Kubectl Commands
To get the output of kubectl in a json format:
kubectl get nodes -o json
kubectl get pods -o json
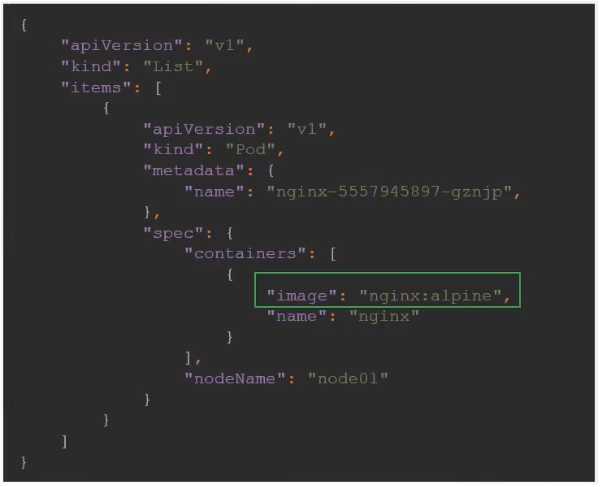
To get the image name used by pod via json path query:
kubectl get pods -o=jsonpath='{.items[0].spec.containers[0].image}'
To get the names of node in the cluster:
kubectl get pods -o=jsonpath='{.items[*].metadata.name}'
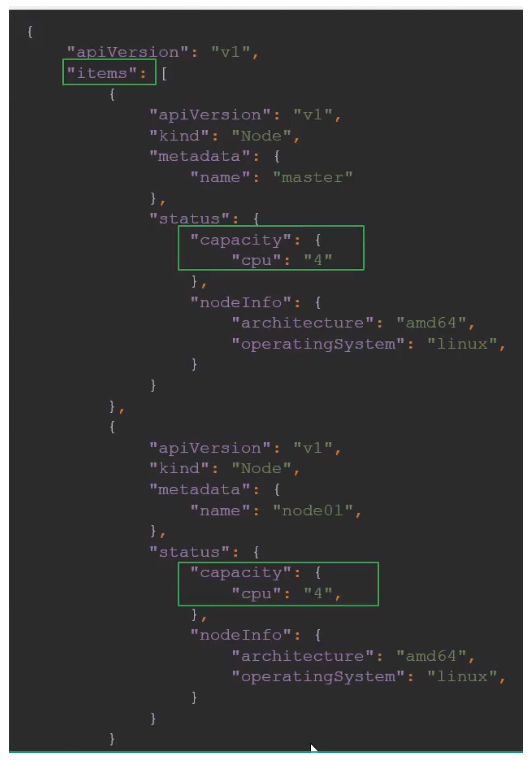
To get the architecture of node in the cluster:
kubectl get pods -o=jsonpath='{.items[*].status.nodeInfo.architecture}'
To get the count of the cpu of node in the cluster:
kubectl get pods -o=jsonpath='{.items[*].status.status.capacity.cpu}'
Loops - Range
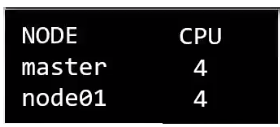
To print the output in a separate column (one column with node name and other with CPU count):
kubectl get nodes -o=custom-columns=NODE:.metadata.name ,CPU:.status.capacity.cpu
Kubectl comes with a sort by property which can be combined with json path query to sort by name or CPU count
kubectl get nodes --sort-by=.metadata.name
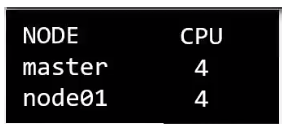
kubectl get nodes --sort-by=..status.capacity.cpu