Logging and monitoring
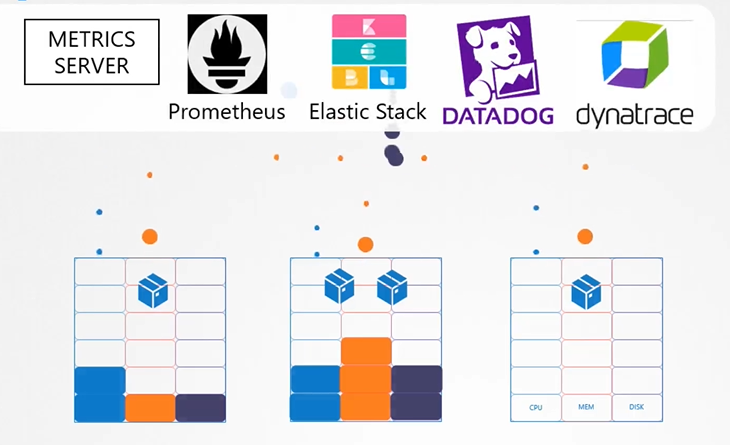
How do you monitor resource consumption in Kubernetes? or more importantly, what would you like to monitor?
-
Cluster level
- Node level
- How many node
- Health of the nodes
- Performance metrics usage
- CPU
- Memory
- RAM
- Disk
- Node level
-
Pod level
- No. pods
- Health of pods
- performance usage
$ k top node
$ k top pod
Heapster vs metrics server
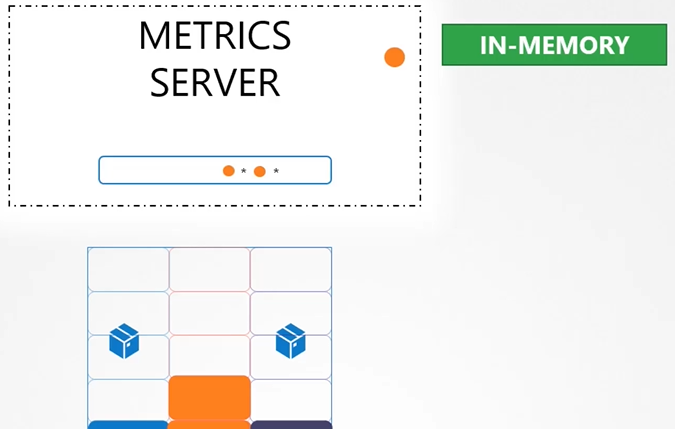
Heapster is now deprecated and a slimmed down version was formed known as the metrics server. It is only an in memory solution. You cannot see historical data.
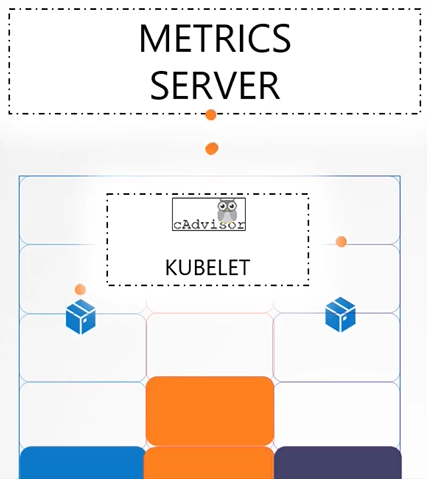
How are the metrics generated for the PODs on these nodes? Kubelet contains a sub component called “cAdvisor”, which is responsible for sending retrieved performance metrics from pods to metrics server.
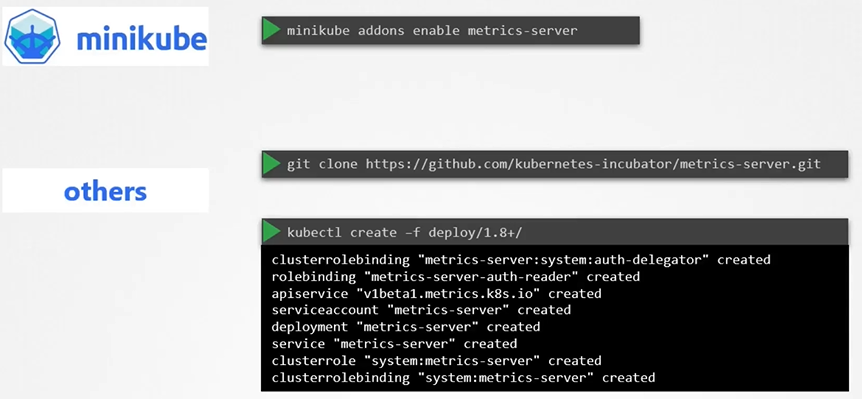
Clone the metric server from github repo
$ git clone https://github.com/Kubernetes-incubator/metrics-server.gitDeploy the metric server
$ kubectl create -f metric-server/deploy/1.8+/View the cluster performance
$ kubectl top nodeView performance metrics of pod
$ kubectl top pod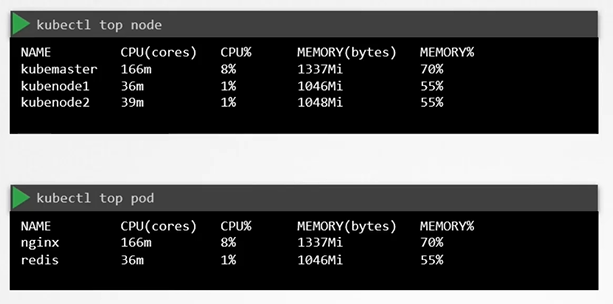
Logs
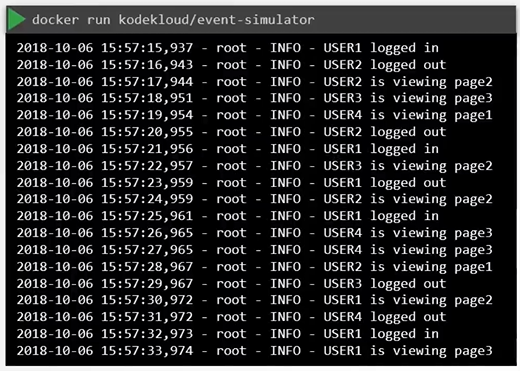
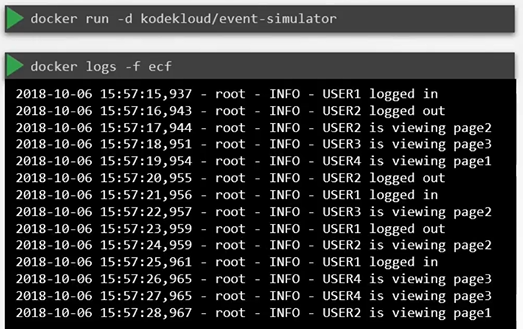
In Docker, logs can be accessed using the docker logs command, while in Kubernetes, logs are viewed with the kubectl logs command. For pods with multiple containers, it’s necessary to specify which container’s logs you want to see.
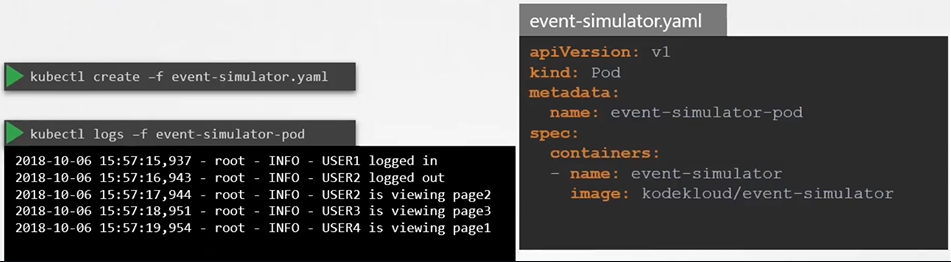
To view the logs:
$ kubectl logs -f event-simulator-podIf there are multiple containers in a pod then you must specify the name of the container explicitly in the command:
$ kubectl logs -f <pod-name> <container-name>
$ kubectl logs -f even-simulator-pod event-simulator
Monitoring Cluster Events
kubectl get events: This command gives an overview of events happening across the entire cluster.kubectl get events -o wide: This command provides a more detailed overview of cluster-wide events.
Use
kubectl get eventswhen it’s unclear which resource an error relates to. If you know the specific resource involved, it’s better to usekubectl describe [resource]on that resource for more targeted information.